- Battery technology is progressing slowly and advances in lithium-metal are not yet commercially available
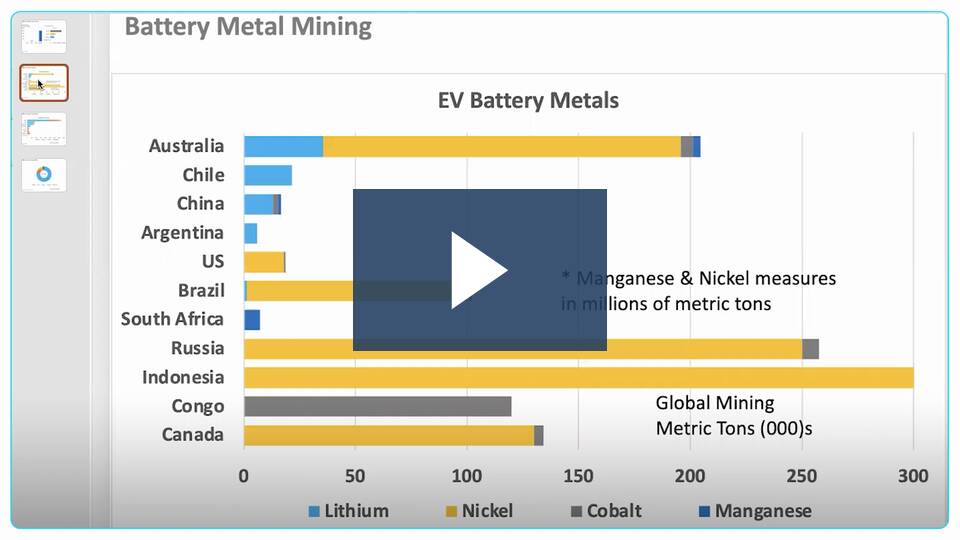
- Federal EV battery incentives pertain to countries with US free trade agreements: Australia, Canada, and Chile
- Battery supply is constrained by metal mining and production is limited by complex and costly process technologies
- More research and product production methods are imminently needed
Battery production for electric vehicles should be a concern. For one, the US has neither the resources nor the production capacity to meet the demand of EV manufacturers. Second, as a national security concern, not having the requisite production infrastructure to support energy transformation leaves the US vulnerable to economic decline and energy price increases. Third, to navigate energy transformation it’s imperative to establish battery production for grid stability and resiliency, particularly when introducing renewable energies.
Currently, lithium-ion batteries are the core foundation for EVs and most vehicle manufacturers are planning to transition to all elective vehicles in the near future. California might ban the sale of new cars running only on gasoline by 2035. The issue is the production of EVs is inextricably linked to the availability of batteries that are limited by supply constraints in both battery metals and production capacity. Our focus is on battery supply chains and production.
Battery Supply Chains
The big issue around EV batteries is assuring an adequate supply of materials at a reasonable price. To better understand the EV supply chain let’s look at the common raw materials namely metals and their associated costs. The four primary metals in a lithium-ion battery commonly used in most EVs are lithium, nickel, cobalt, and manganese. EV batteries use nickel-manganese-cobalt cathodes, with 60% nickel and 20% of cobalt and manganese.
The Possible Achilles’ Heel of EVs and Energy Storage – MarketScale